TECHNICAL GUIDE / FREE TOOLS
How to Use the PORTA Microgrid Configurator: A Visual Step-by-Step Guide
Designing an off-grid power system used to take weeks of back-and-forth with engineering teams. The PORTA Microgrid Configurator compresses that into under five minutes — giving you a complete equipment list, 24-hour energy simulation, diesel savings analysis, and a downloadable PDF technical proposal.
This guide walks through every screen of the configurator using a real Riyadh-based mining camp scenario. Whether you are running a remote excavation site, a concrete batching plant, or an island village, the process is identical.
Step 1 — Choose Your Input Mode
The configurator offers three ways to describe your power needs. Pick the one that matches how much data you already have.
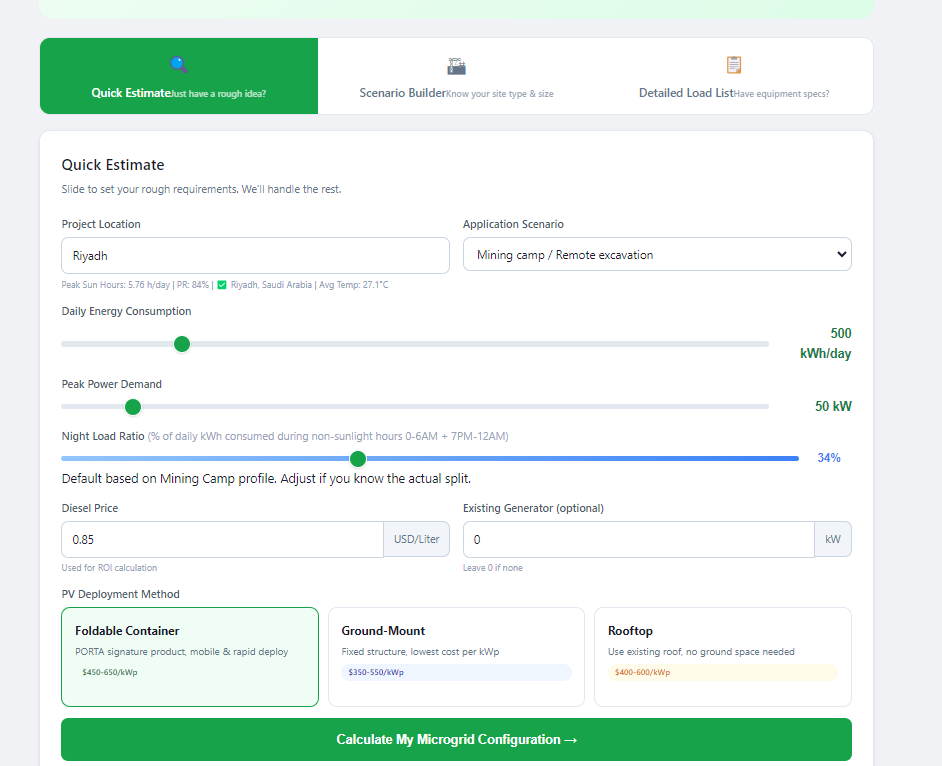
Mode A: Quick Estimate
Best for early-stage planning when you only know rough numbers.
- Project Location — Type your city (e.g., Riyadh). The tool auto-fetches local Peak Sun Hours (5.76 h/day for Riyadh), temperature, and solar performance ratio (PR 84%).
- Daily Energy Consumption — Slide to your estimated kWh per day.
- Peak Power Demand — The highest simultaneous load in kW.
- Night Load Ratio — Percentage of daily energy consumed during dark hours (0–6 AM + 7 PM–12 AM). The slider defaults to a sensible value based on your application scenario.
- Diesel Price — Enter your local fuel cost in USD/liter for ROI calculations.
- Existing Generator — Optional. Leave at 0 if you are starting from scratch.
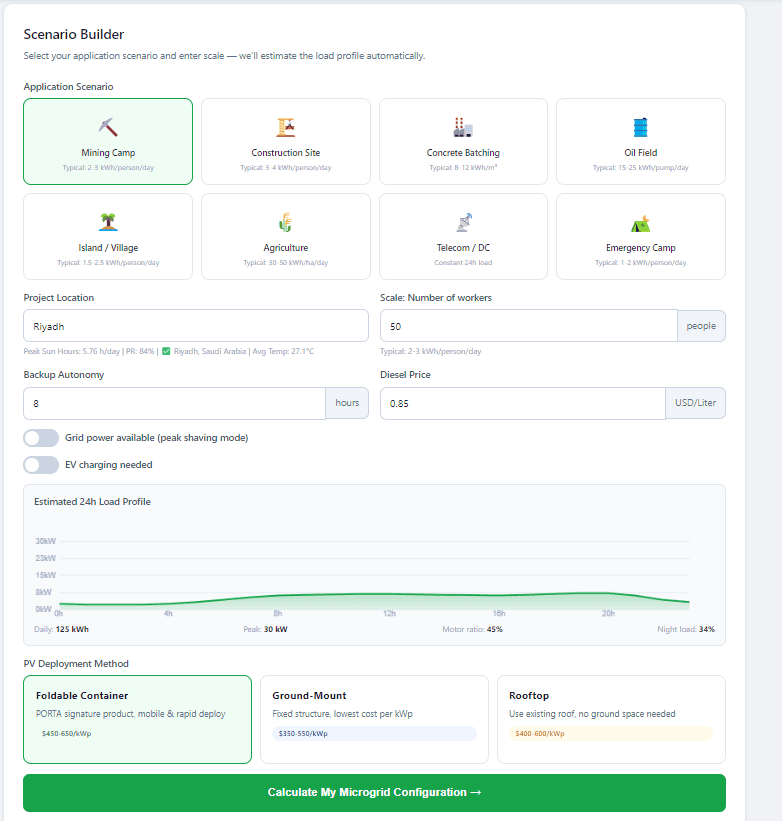
Mode B: Scenario Builder
Best when you know the site type and headcount but do not have an equipment list yet.
Select one of eight pre-built application scenarios: Mining Camp, Construction Site, Concrete Batching, Oil Field, Island / Village, Agriculture, Telecom / DC, or Emergency Camp. Each scenario carries a typical energy-intensity profile. Enter the scale (number of workers, hectares, or pump count), set backup autonomy in hours, and toggle grid availability or EV charging if applicable. The configurator immediately draws an estimated 24-hour load profile below the inputs.
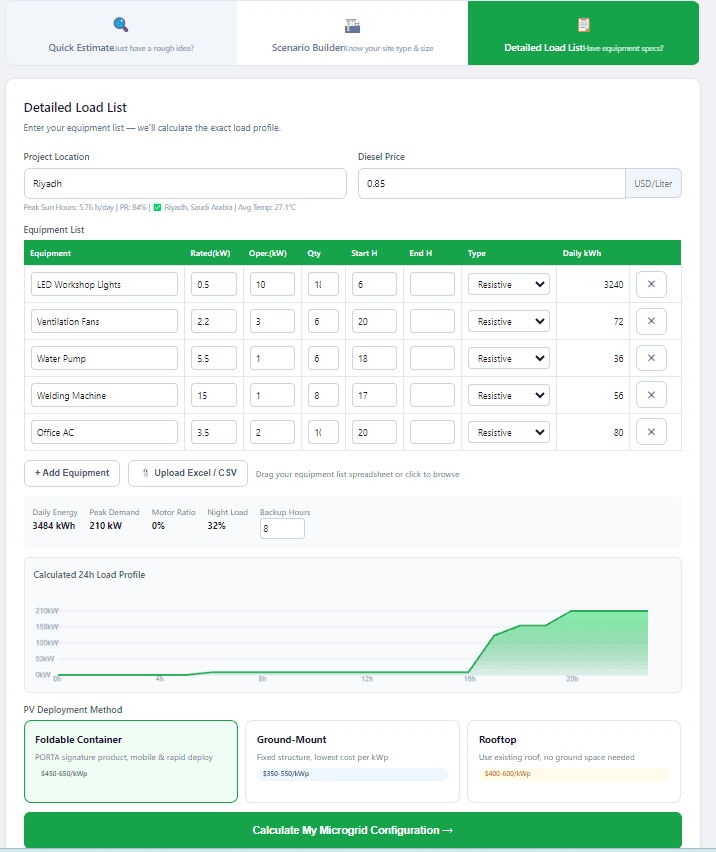
Mode C: Detailed Load List
Best for engineers who already have an equipment schedule.
Build a table row-by-row: equipment name, rated power (kW), quantity, operating hours (start and end), and load type (resistive or motor). The configurator calculates daily kWh per line and aggregates a peak demand, motor ratio, and night-load percentage in real time. You can also upload an Excel or CSV file instead of typing — ideal for large camps with dozens of loads.
Step 2 — Pick Your PV Deployment Method
Below the inputs, three deployment cards let you choose how solar is installed. This choice directly affects product matching and cost:
For mining and construction camps that relocate every few years, the Foldable Container is usually the best fit. It packs into a standard shipping container and deploys on tracks without cranes. Once you have selected a mode and deployment method, click "Calculate My Microgrid Configuration".
Step 3 — Compare the Two Strategies
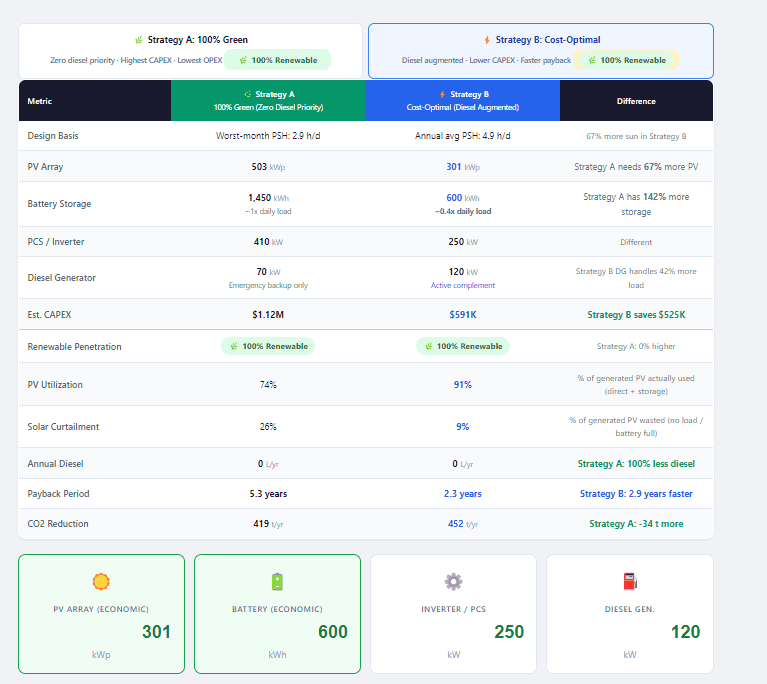
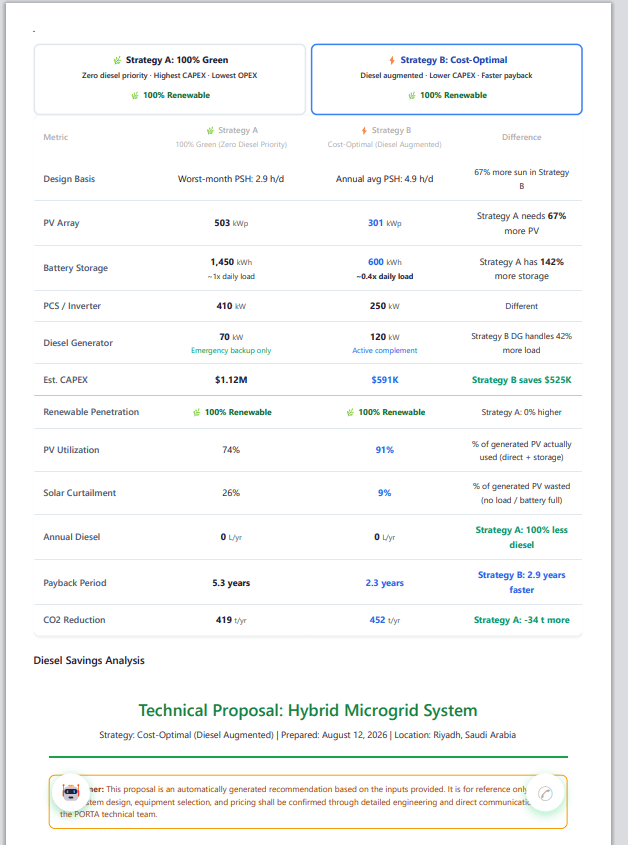
The configurator does not give you one answer — it gives you two, side by side, so you can decide what matters most for your project.
Strategy A: 100% Green (Zero Diesel Priority) — Sized for the worst solar month (conservative design). Highest CAPEX, lowest OPEX. Diesel generator present only for emergency backup. Best for sites with strict ESG mandates or unpredictable fuel logistics.
Strategy B: Cost-Optimal (Diesel Augmented) — Sized for annual average solar conditions. Lower CAPEX, faster payback. Diesel runs as an active complement during cloudy weeks. Best for budget-constrained projects where some diesel is acceptable.
Notice that even the "Cost-Optimal" strategy achieves 100% renewable penetration in this Riyadh scenario because solar resource is abundant. The difference is purely in sizing philosophy and capital outlay.
Step 4 — Read Your Recommended Solution Package
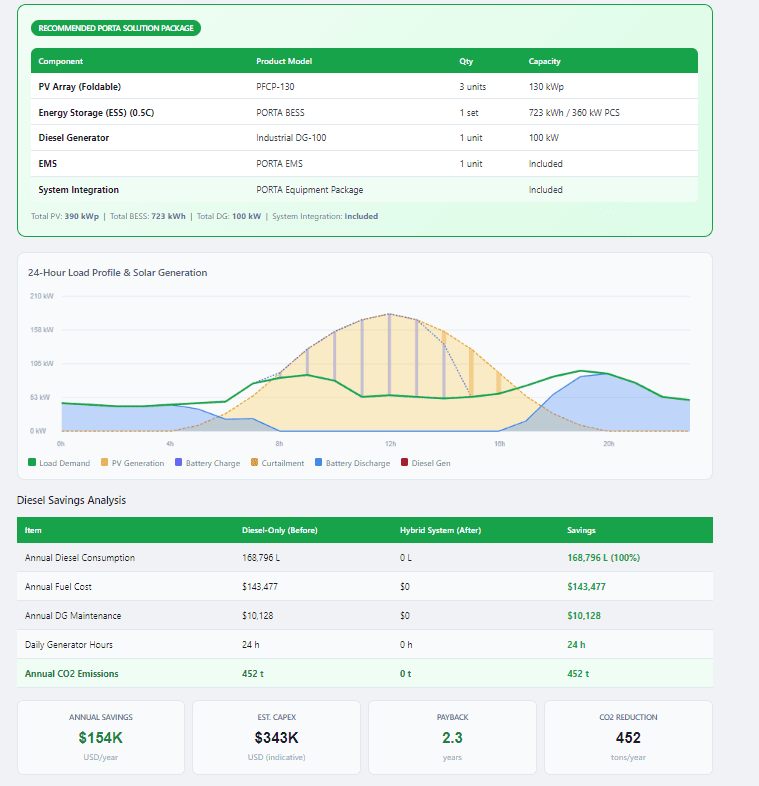
After you select a strategy, the configurator displays a BOM-style recommendation using actual PORTA product SKUs:
Totals: 390 kWp PV | 723 kWh BESS | 100 kW DG | Integration included
This is not a generic parts list. Every model maps to a real PORTA product with factory-tested parameters, so you can move straight from concept to quotation.
Step 5 — Review the 24-Hour Energy Flow Simulation
Directly beneath the BOM, an interactive chart shows how energy moves through the system across a full day:
- Green line — Load demand
- Yellow area — PV generation
- Blue area — Battery charging
- Light blue area — Battery discharging
- Orange area — Solar curtailment (excess PV that cannot be stored)
- Red area — Diesel generation
Hover over any hour to see the exact kW values. In the Riyadh example, the battery charges aggressively during midday peak sun, then discharges through the evening and early morning. Diesel remains offline because the battery and solar combination covers the full 24-hour cycle.
Step 6 — Check Diesel Savings & Key Performance Indicators
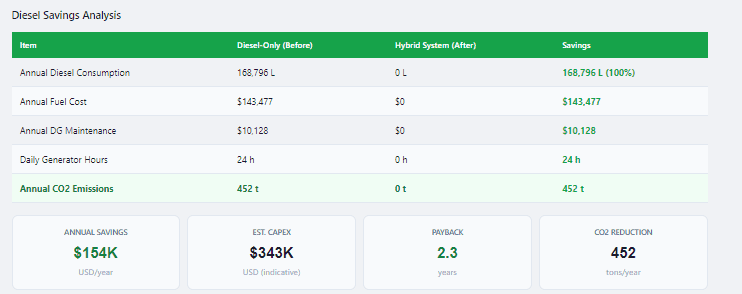
The Diesel Savings Analysis table compares your current diesel-only baseline against the new hybrid system:
Four KPI cards summarize the financial and environmental impact: Annual Savings $154K USD/year, Est. CAPEX $343K USD (indicative), Payback 2.3 years, and CO₂ Reduction 452 tons/year.
Step 7 — View 10-Year Cash Flow & Payback
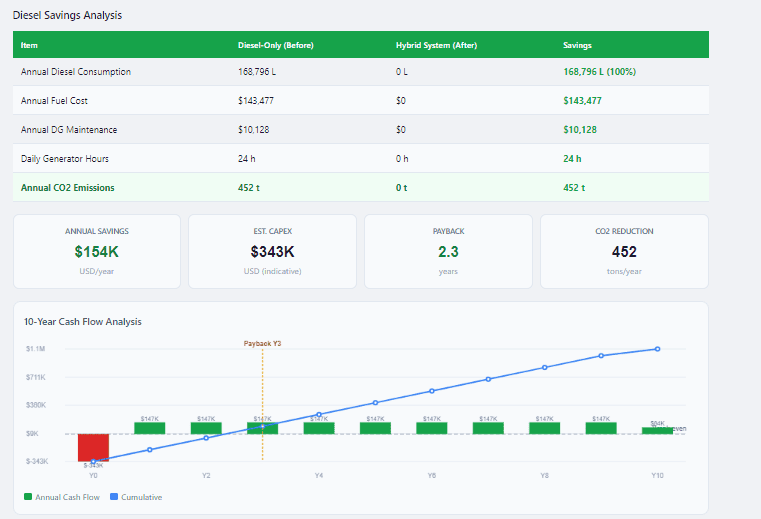
Scroll down to the 10-Year Cash Flow Analysis chart. A stacked bar-and-line graph shows:
- Red bar (Year 0) — Initial CAPEX outlay (-$343K)
- Green bars (Years 1–10) — Annual cash flow from fuel and maintenance savings (~$47K/year)
- Blue line — Cumulative net cash position
- Payback marker — The exact year when the blue line crosses zero (2.3 years in this example)
This gives CFOs and project financiers a clear picture of liquidity and break-even timing without opening a spreadsheet.
Step 8 — Review the System Architecture Diagram
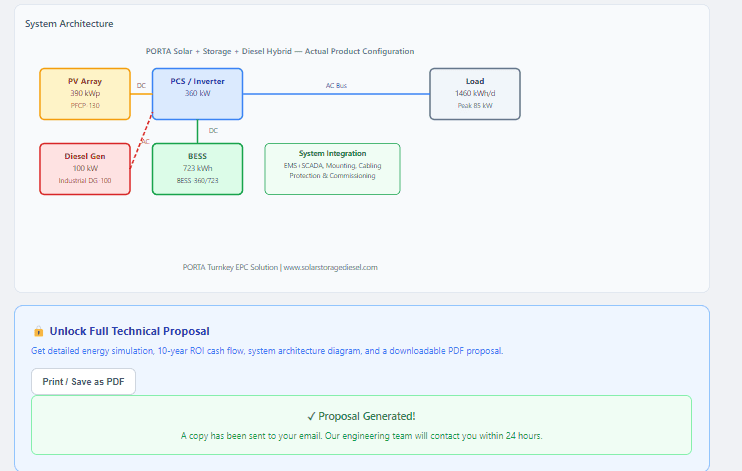
A single-line diagram shows the electrical topology of the recommended system:
- PV Array (390 kWp, PFCP-130) feeds DC power to the PCS
- PCS / Inverter (360 kW) converts DC to AC and manages the AC bus
- BESS (723 kWh) connects on the DC side of the PCS for charge/discharge
- Diesel Gen (100 kW) ties to the AC bus as backup
- Load (1,460 kWh/day, 85 kW peak) draws from the AC bus
- System Integration box covers EMS/SCADA, mounting, cabling, protection, and commissioning
This diagram is generated automatically from the sizing results. You can drop it straight into a client presentation or permit application.
Step 9 — Unlock the Full PDF Technical Proposal
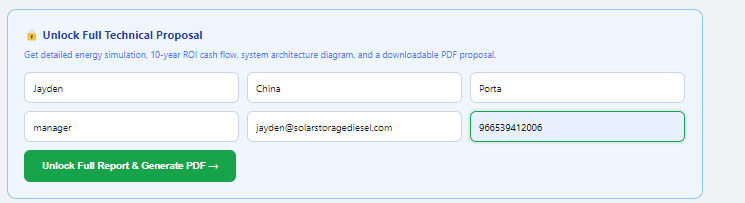
All results so far are free and instant. To download a branded, printable PDF proposal with full technical specifications, enter your contact details in the unlock form:
- Name, country, company, title
- Business email and phone number
Click “Unlock Full Report & Generate PDF”. The system emails you the proposal within seconds and flags your project for follow-up by the PORTA engineering team.
- Executive summary with strategy comparison
- Full BOM with product specifications
- Diesel savings and CO₂ reduction analysis
- 10-year cash flow table
- System architecture diagram
- Disclaimer and next-step contact information
Frequently Asked Questions